DATA ENGINESDATA CONSULTING BY DANIEL DOGBEY
Behind every number,
a better question.
I’m Daniel Dogbey. Through Data Engines, I turn scattered data into reliable reporting, automated workflows, and clearer decisions.BASED IN ACCRA · WORKING ACROSS BORDERS
FIELD NOTES — 001BUSINESS INTELLIGENCESCROLL TO EXPLORE ↓
A CLOSER LOOKRevenue tells
Revenue tells
half the story.
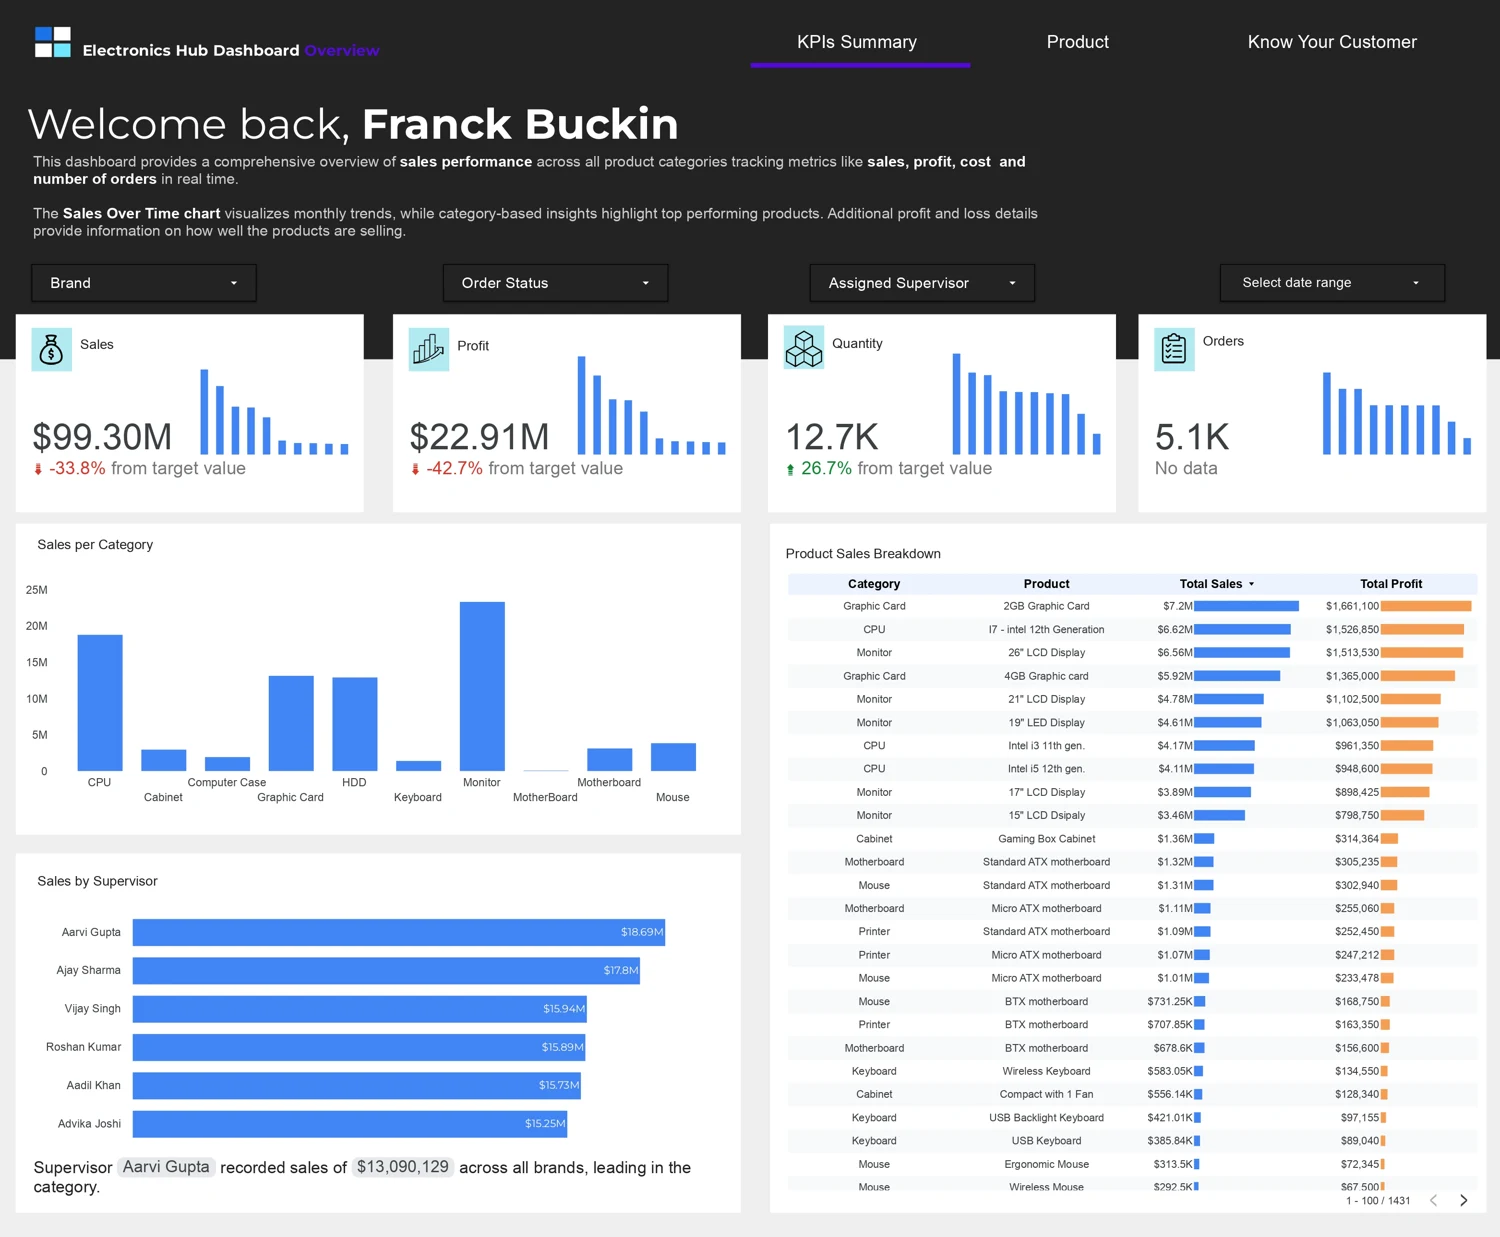
Sales, profit, and performance.
One view of how a business is doing.
LOOKER STUDIO / STATIC DASHBOARD PREVIEW ↗ ENLARGE
SELECTED PROJECT / ELECTRONICS HUBAnalysis → Structure → Clarity
01 / SELECTED WORK
Different problems.
The same curiosity.
A selection of reporting, automation, and data engineering projects. Open a case study to see the approach.
Community impact / illustrative reportOpen report
Scrolling preview
Open full Community Impact microsite
Click the preview or button to explore the complete report website.
FEATURED SERVICE / REPORT WEBSITES
There’s a story
in the detail.
An annual report, programme evaluation, or impact update—built as a report website you can add to your own site. Give your audience clear chapters, animated charts, and a shareable reading experience.
Add a report to your website Two illustrative report websites · Community Impact and Annual SalesHOW I CAN HELP
From a new system
to the team behind it.
Work with me on a complete data workflow, or bring my skills into the work your team already does.
Build a connected
monitoring system.
From data collection and quality checks to cloud pipelines, dashboards, and automated reports—a complete workflow that helps your organisation track performance and act on results.
Discuss a projectBring practical expertise
into your team.
Hands-on support across analysis, data engineering, and business intelligence, with the technical range to contribute to existing workflows and deliver useful work.
Explore my experience02 / EXPLORE THE DATA MODEL
A look beneath the dashboard.
Explore the relationships behind the Electronics Commerce dashboard. Select a table or field to trace how the data connects.
Explore the model: click a table or field to see its relationships.
dim_dateDimension
dim_productDimension
fact_salesFact table
dim_locationDimension
dim_supervisorDimension
Why this matters: the model sits between the business question and the dashboard. It is the foundation that makes analysis consistent, explainable, and easier to extend.
THE PERSON BEHIND DATA ENGINES
Good reporting starts
before the dashboard.
In my role with Rising Learning Technologies, I work across data collection, SQL transformations, quality checks, and reporting for multi-country programmes. The job is as much about asking the right questions as it is about building the right charts.
Experience & education2025 — PRESENT
IN PRACTICE
Group Data Associate
Insights & Impact
Rising Learning Technologies
IN PRACTICE
Power BI · Looker Studio
GCP–BigQuery · AWS · SQL
Cloud data engineering & ETL
Product & stakeholder collaboration