THE PROJECT COLLECTION
Questions explored.
Work, explained.
Dashboards, models, pipelines, and reporting workflows. A collection of project work showing how I approach different data problems.
Screenshots and recorded previews · Dashboard controls are not live22 projects
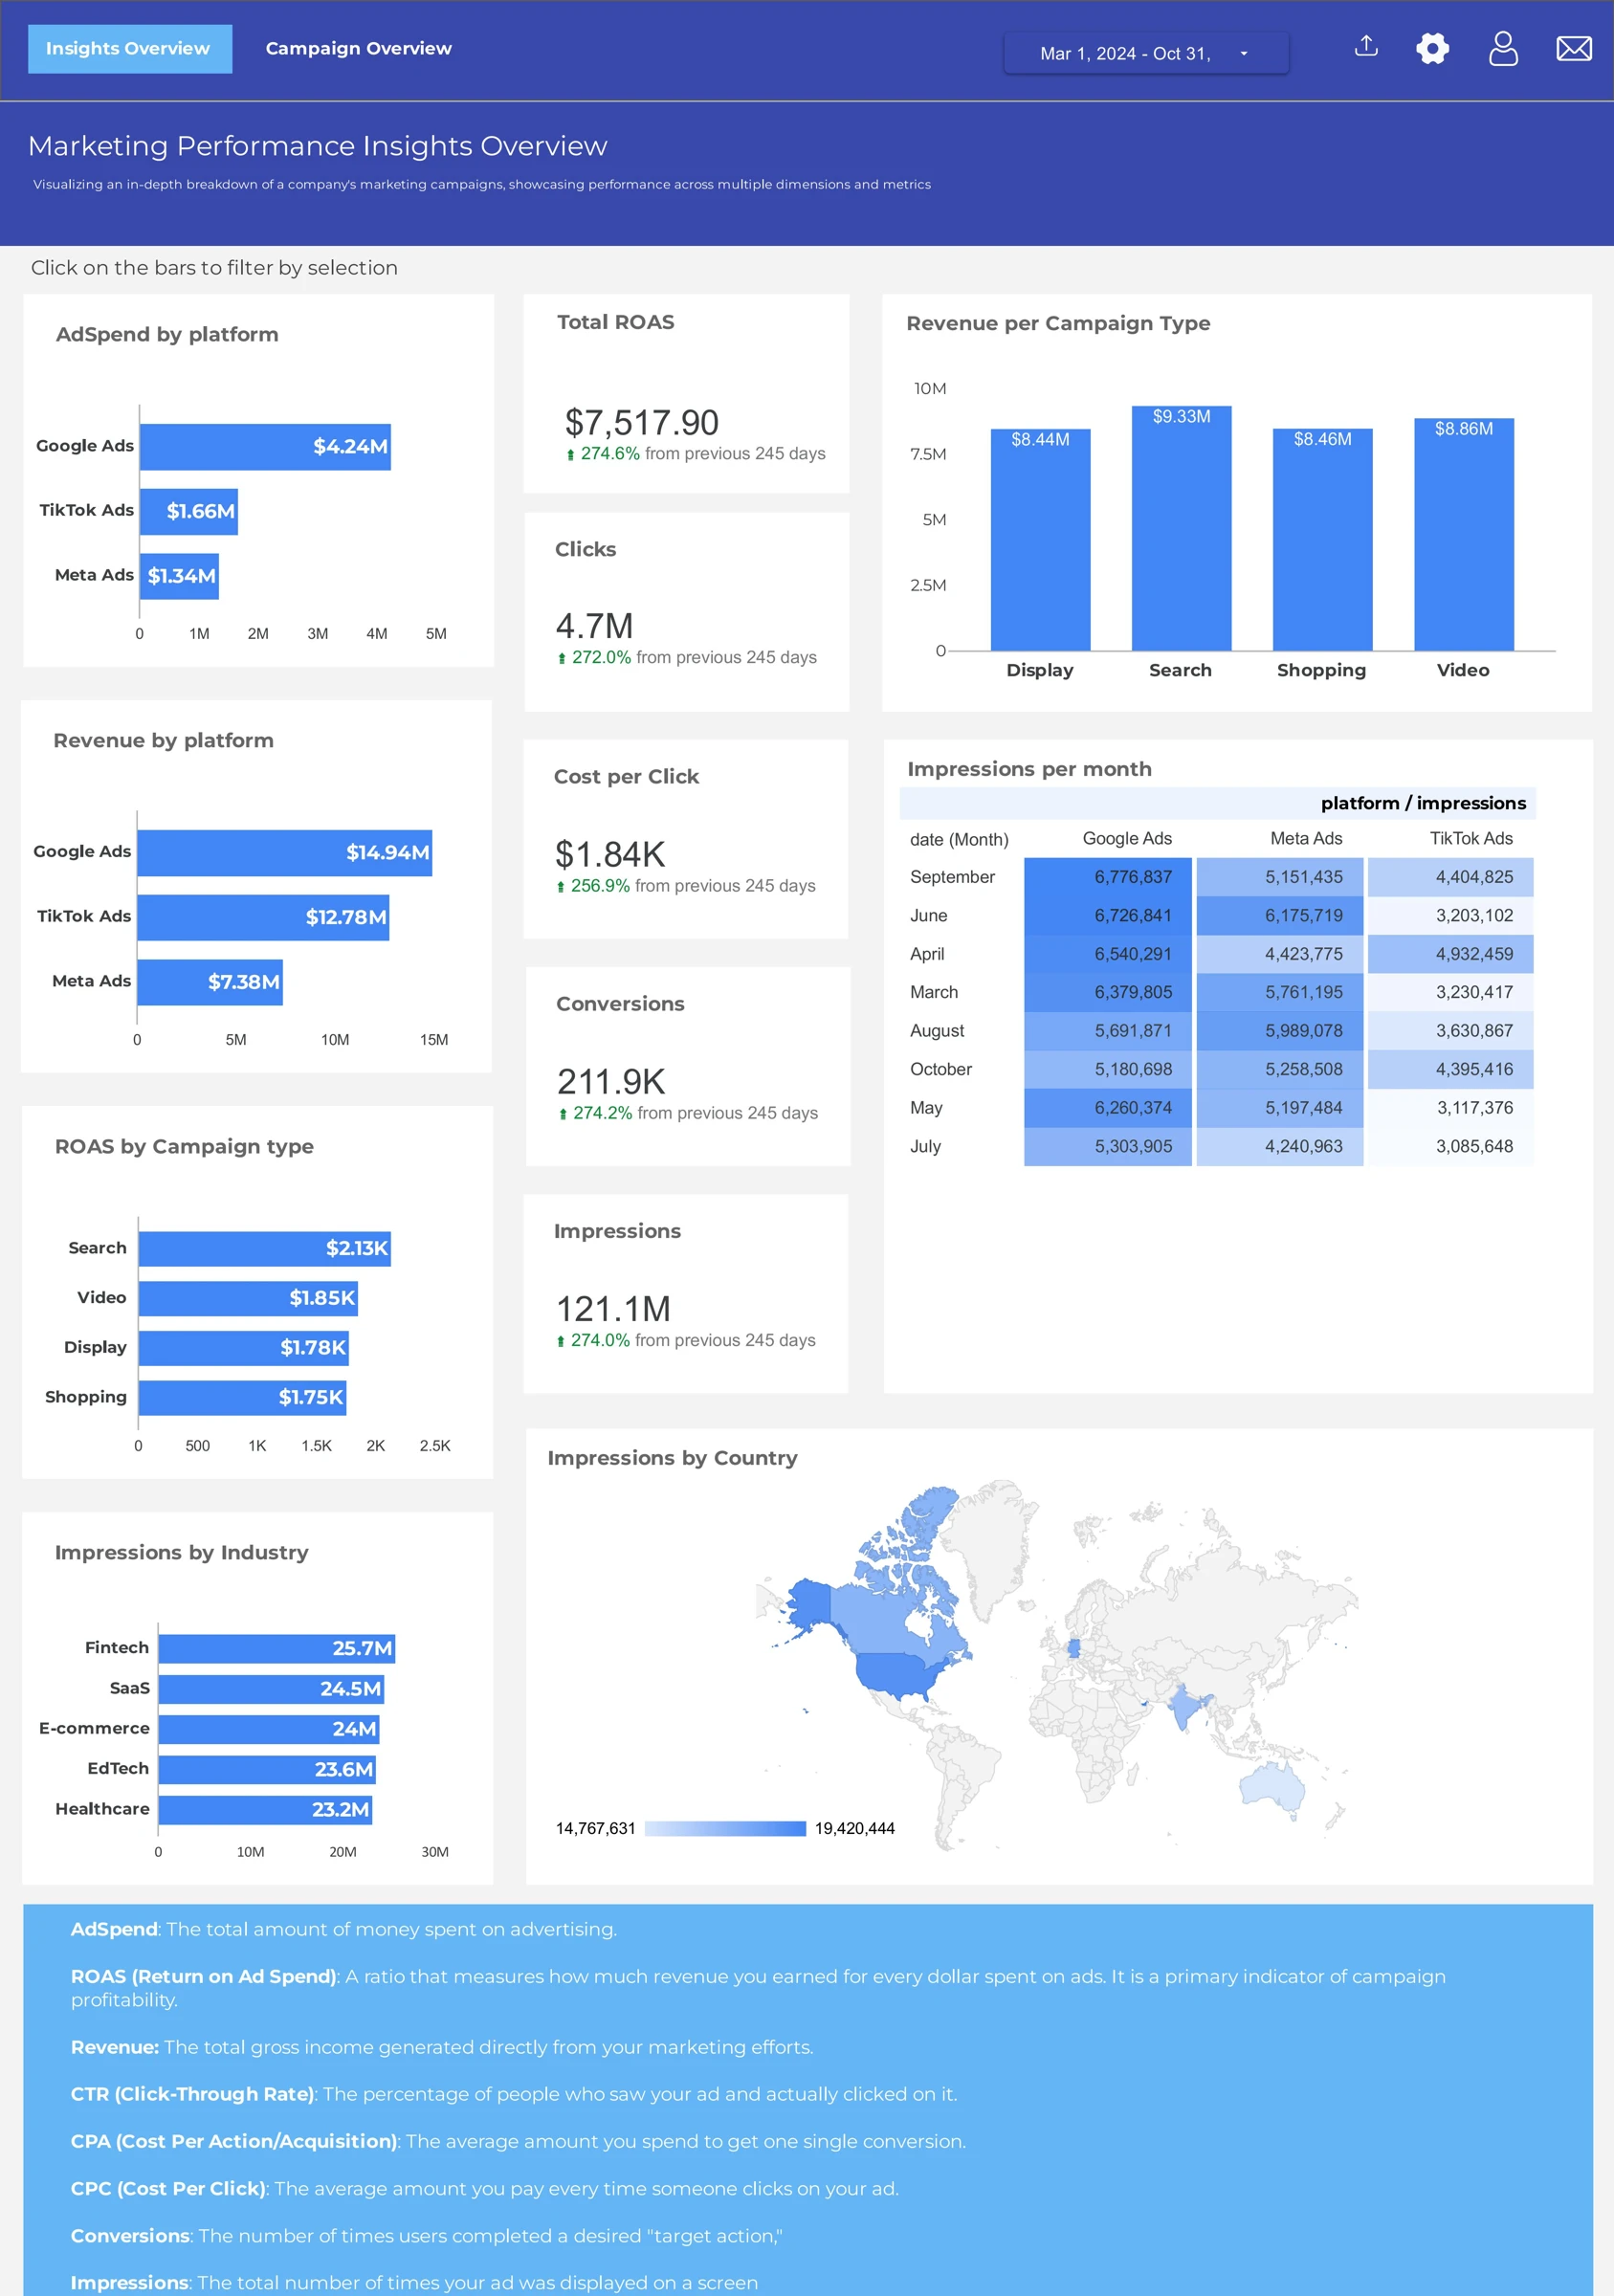
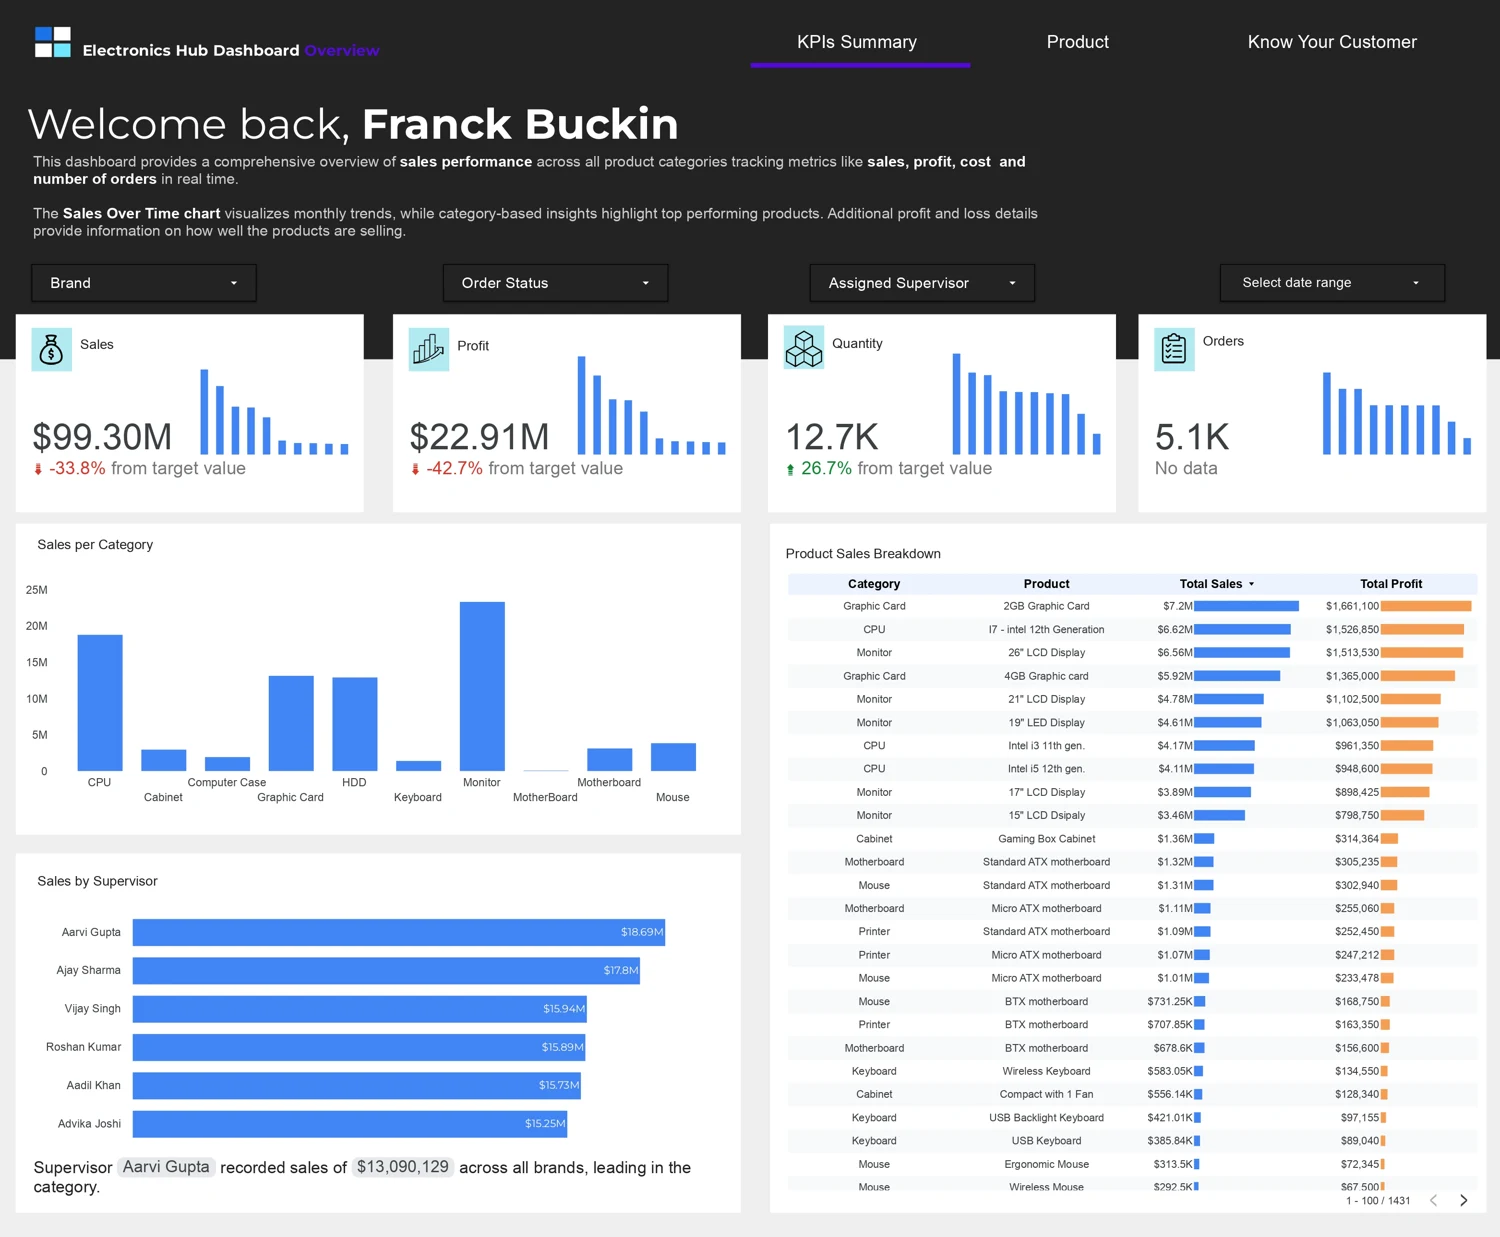
Electronics Hub Dashboard
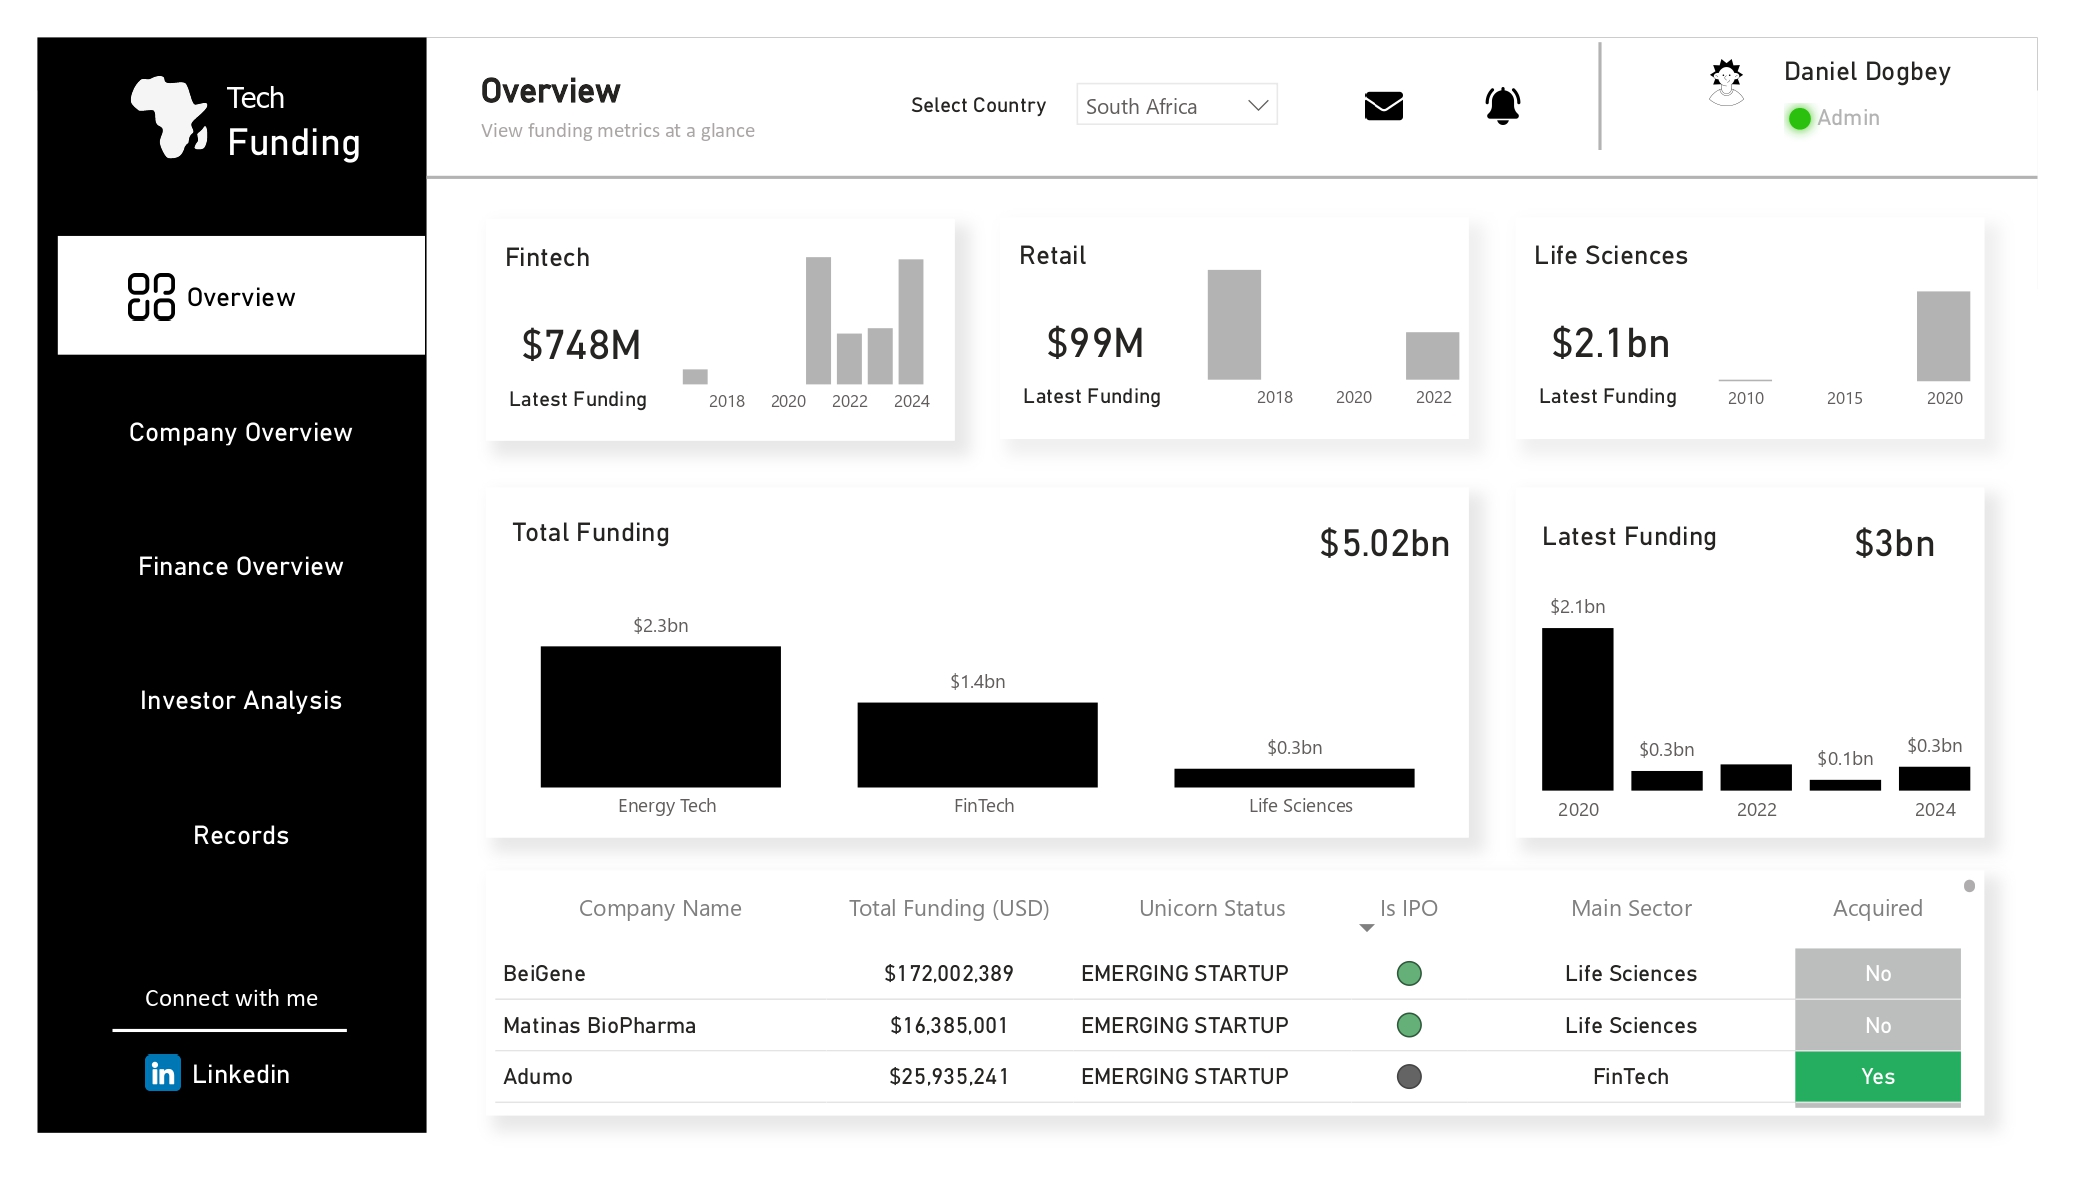
Power BI dashboard: Analyzing Africa's Tech Funding Landscape
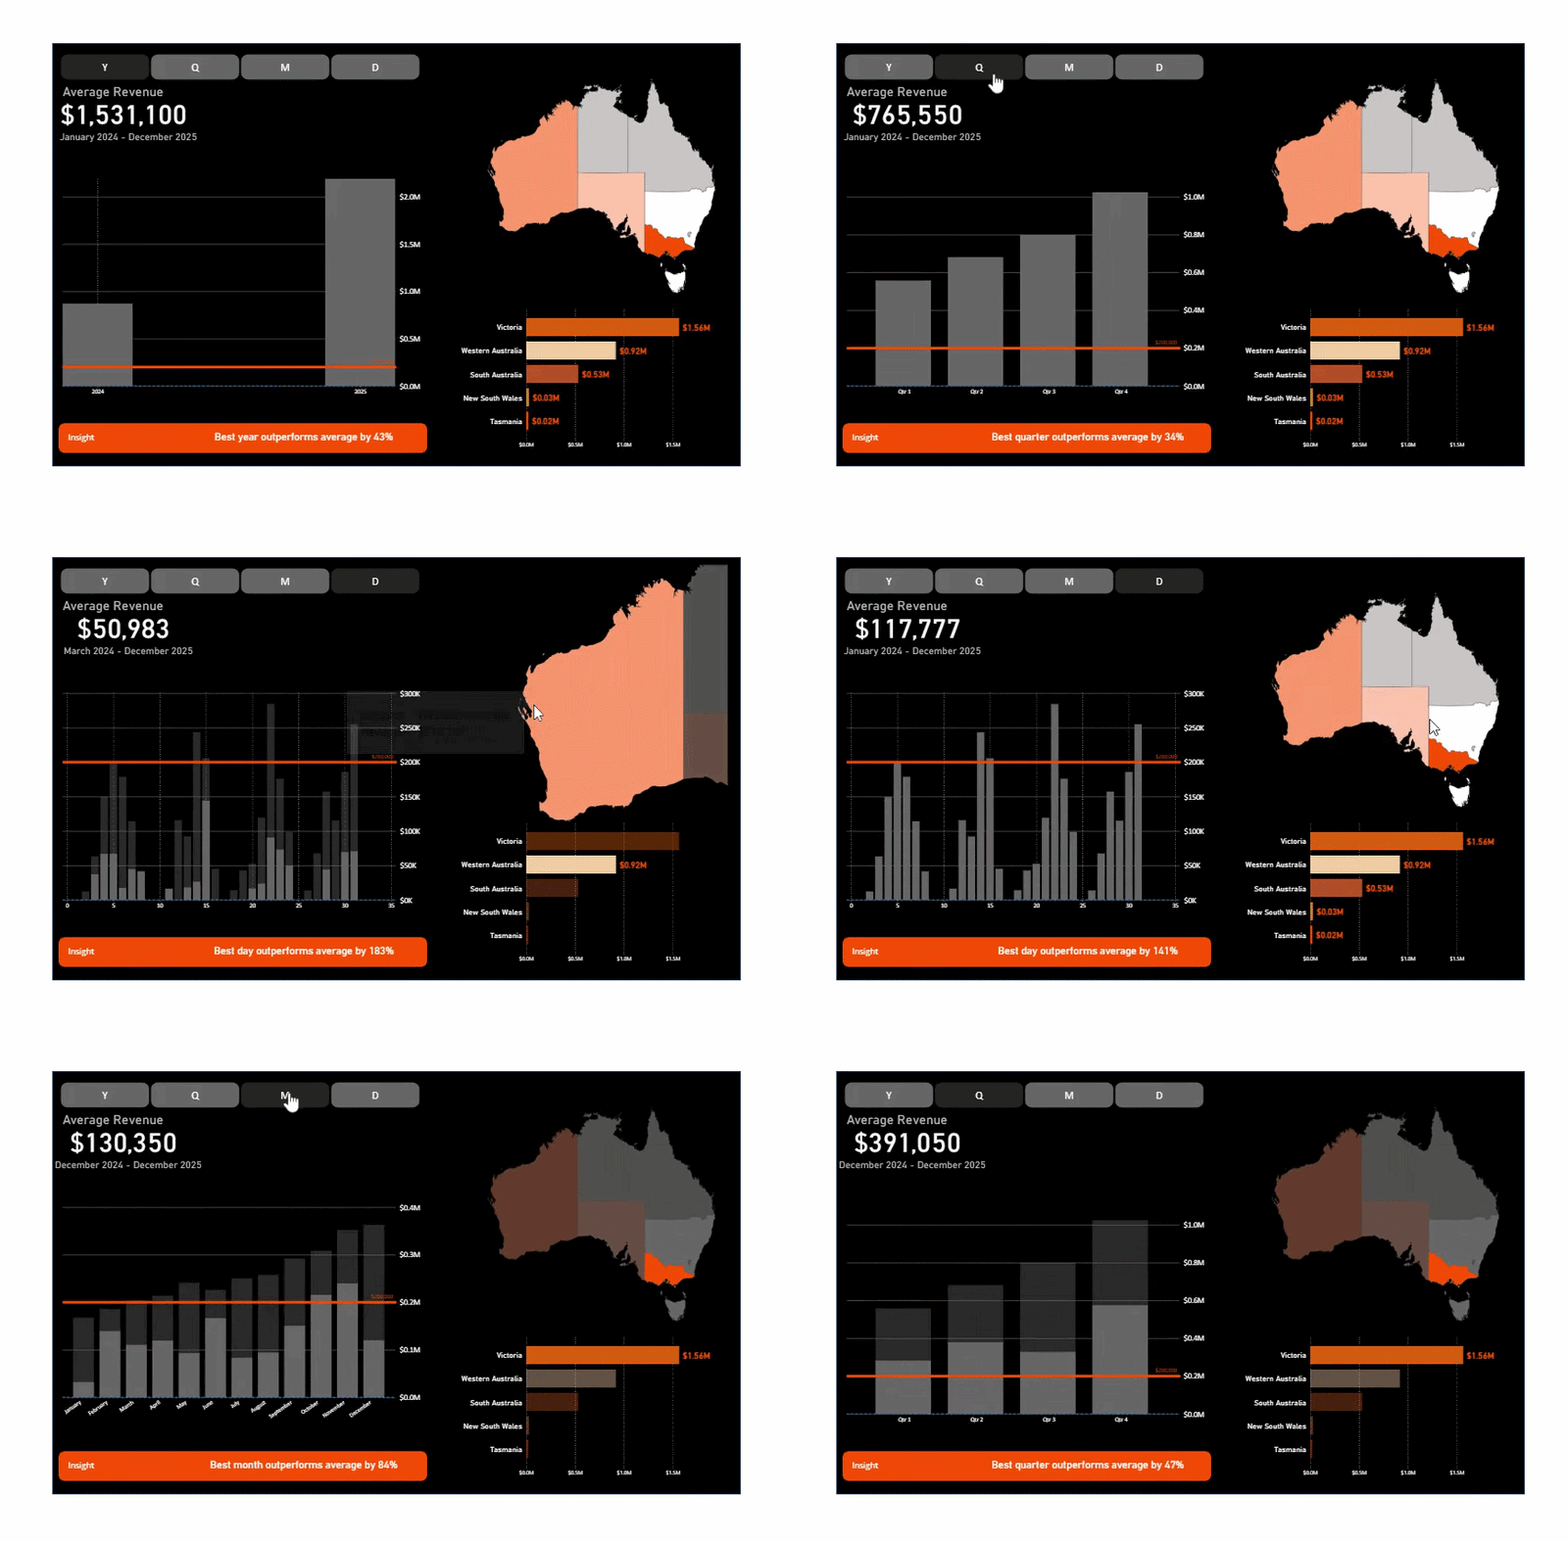
Average Revenue & Regional Performance Data Widget
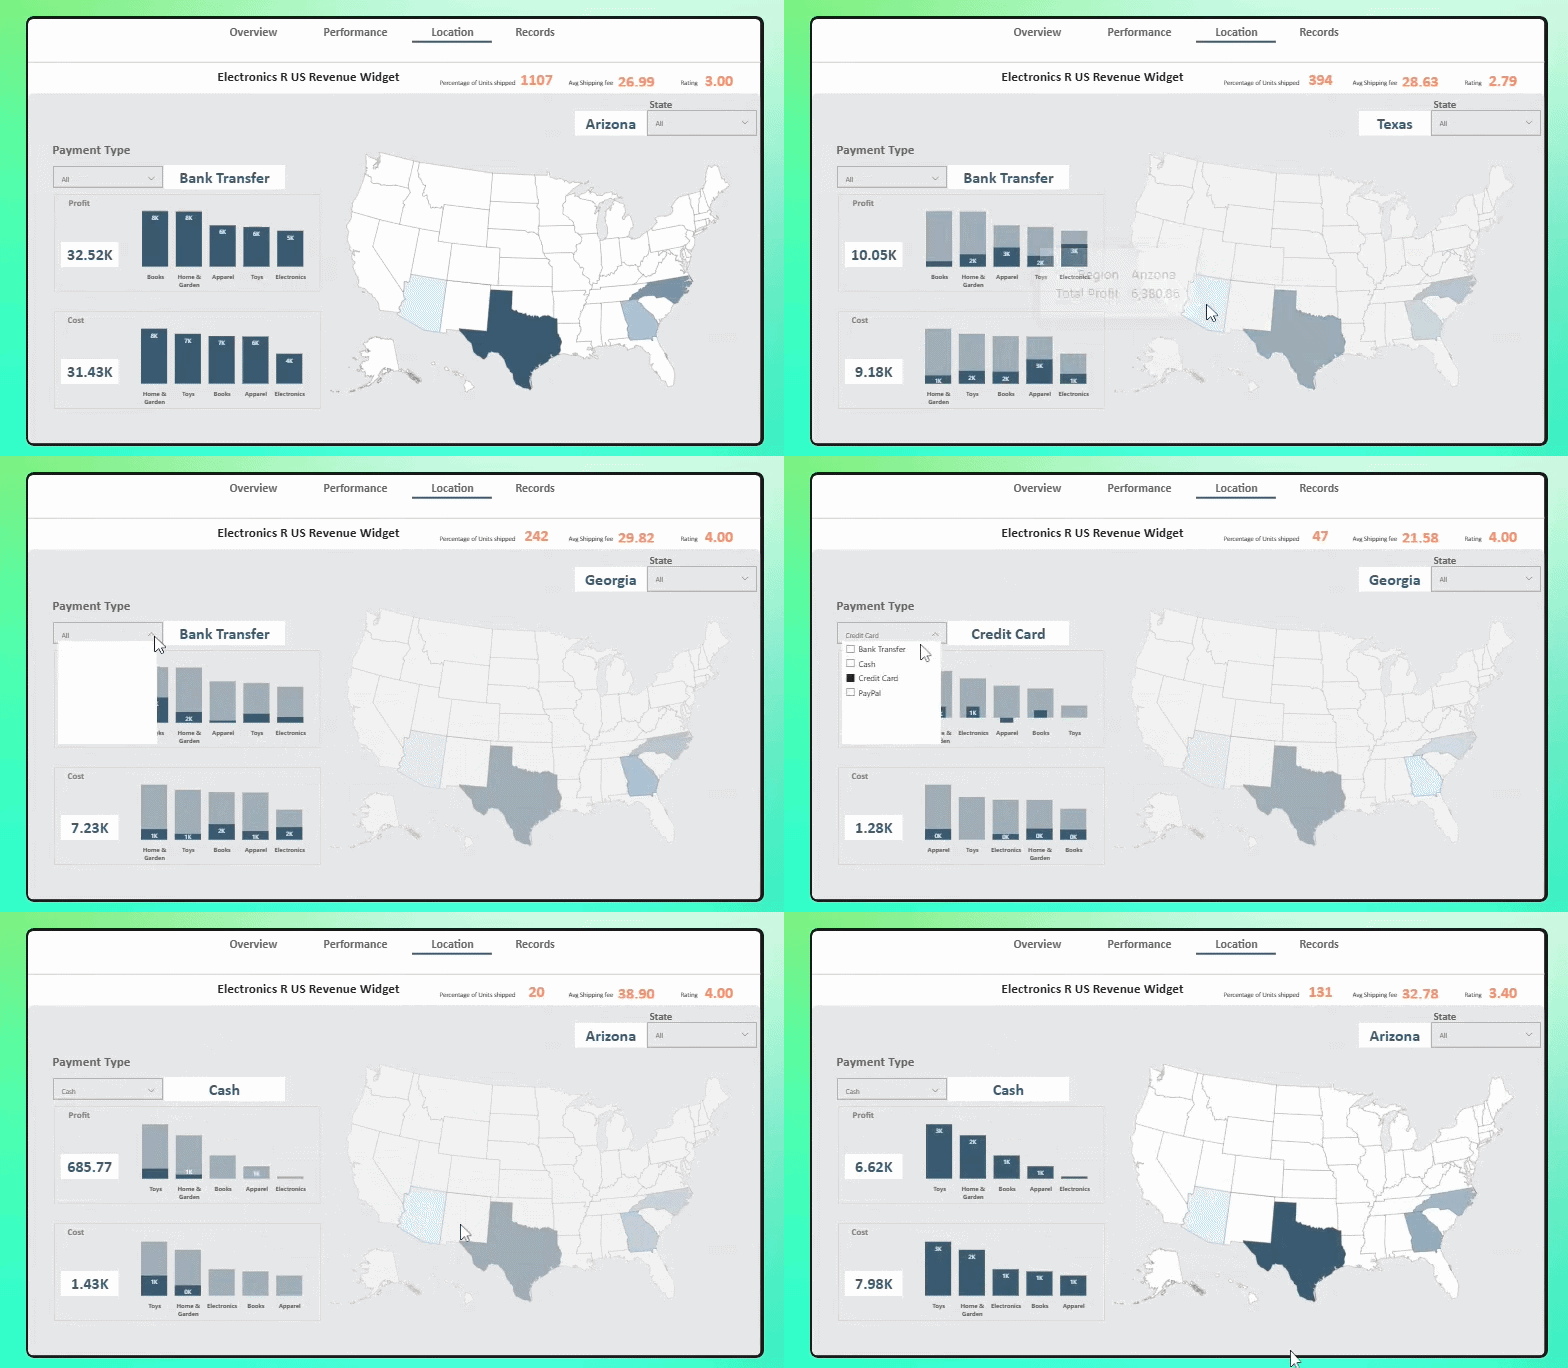
Electronics R US: Location & Performance Dashboard
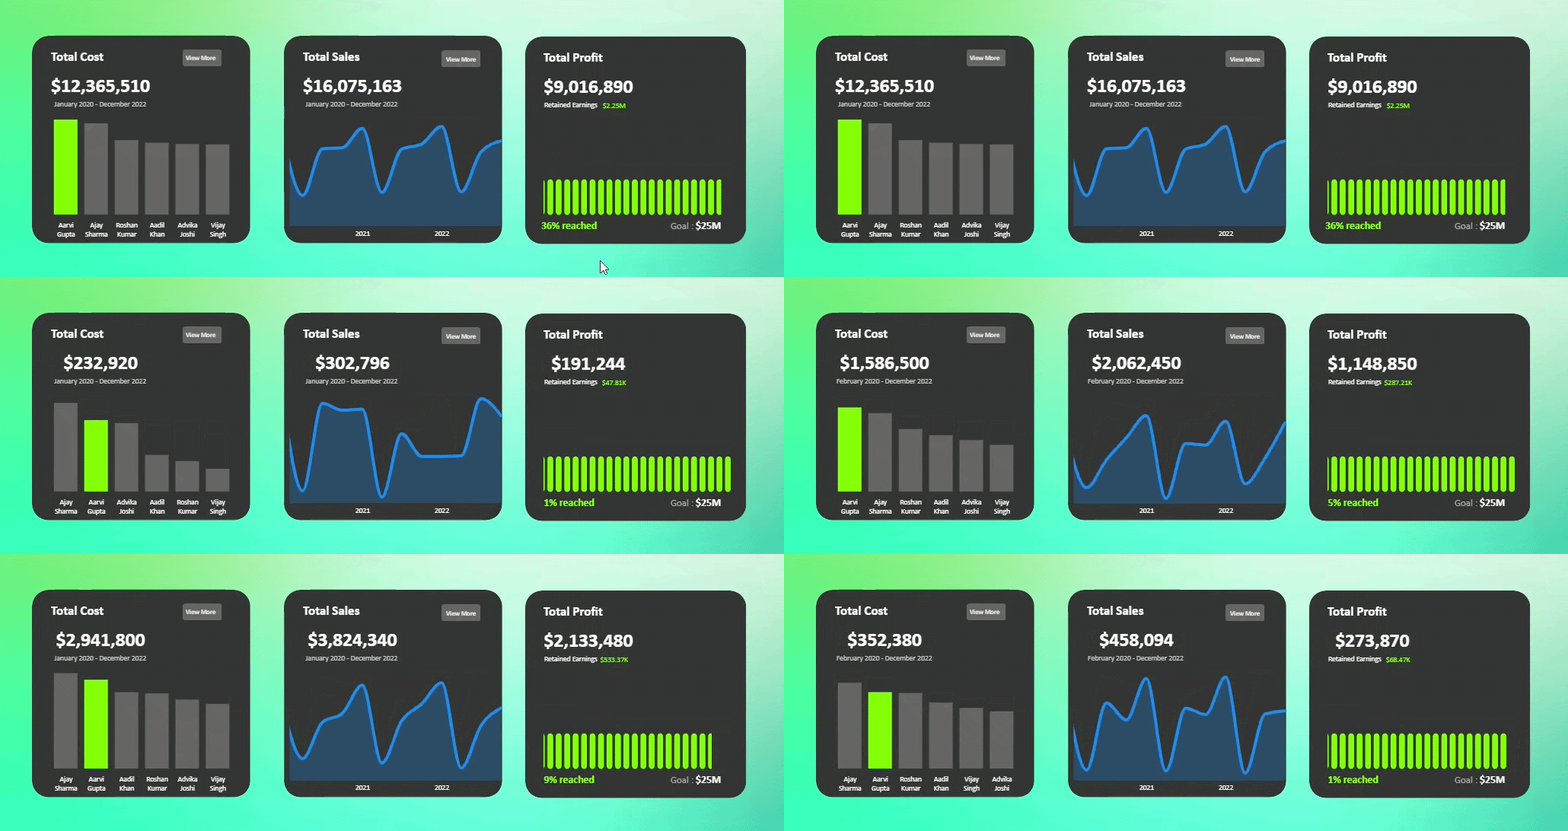
Modern KPI Cards: Reimagining Dashboard Design
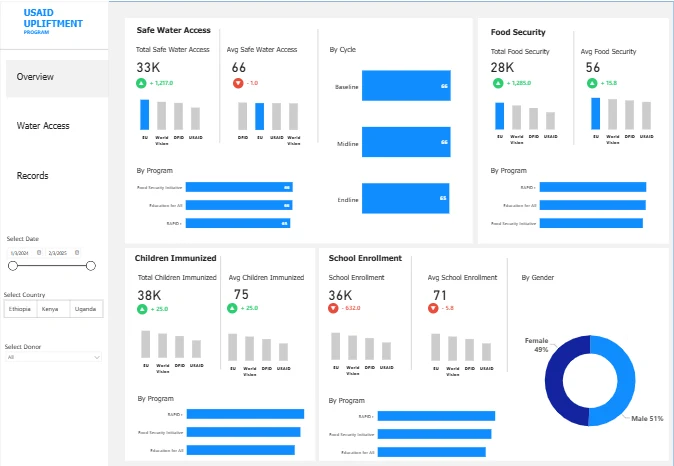
USAID Upliftment Program Dashboard
AI-Powered Operational Reporting & Delivery Pipeline
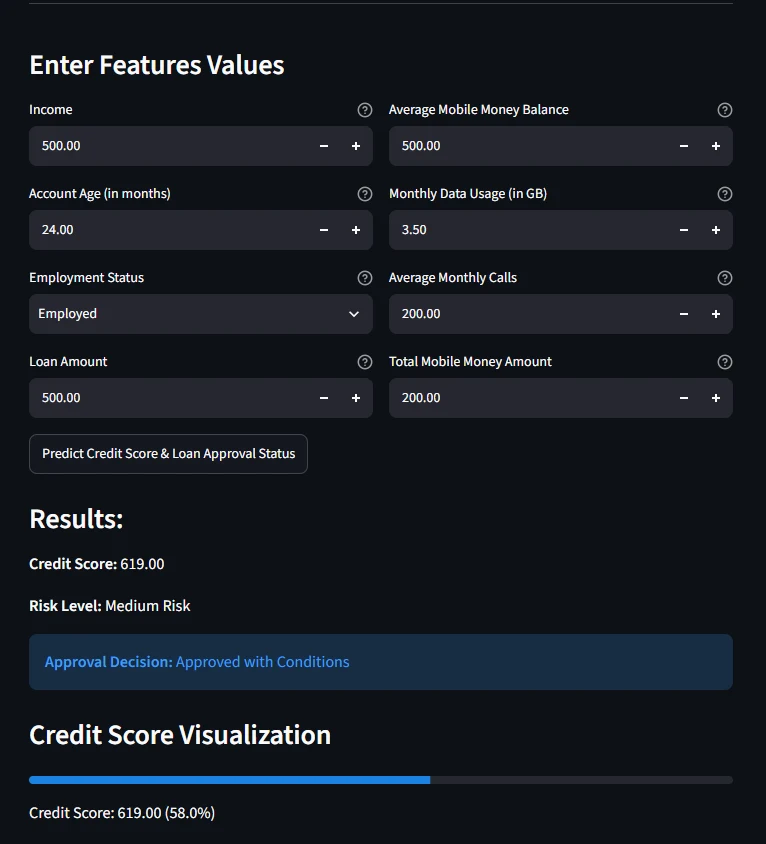
Credit Scoring Analysis and Modeling
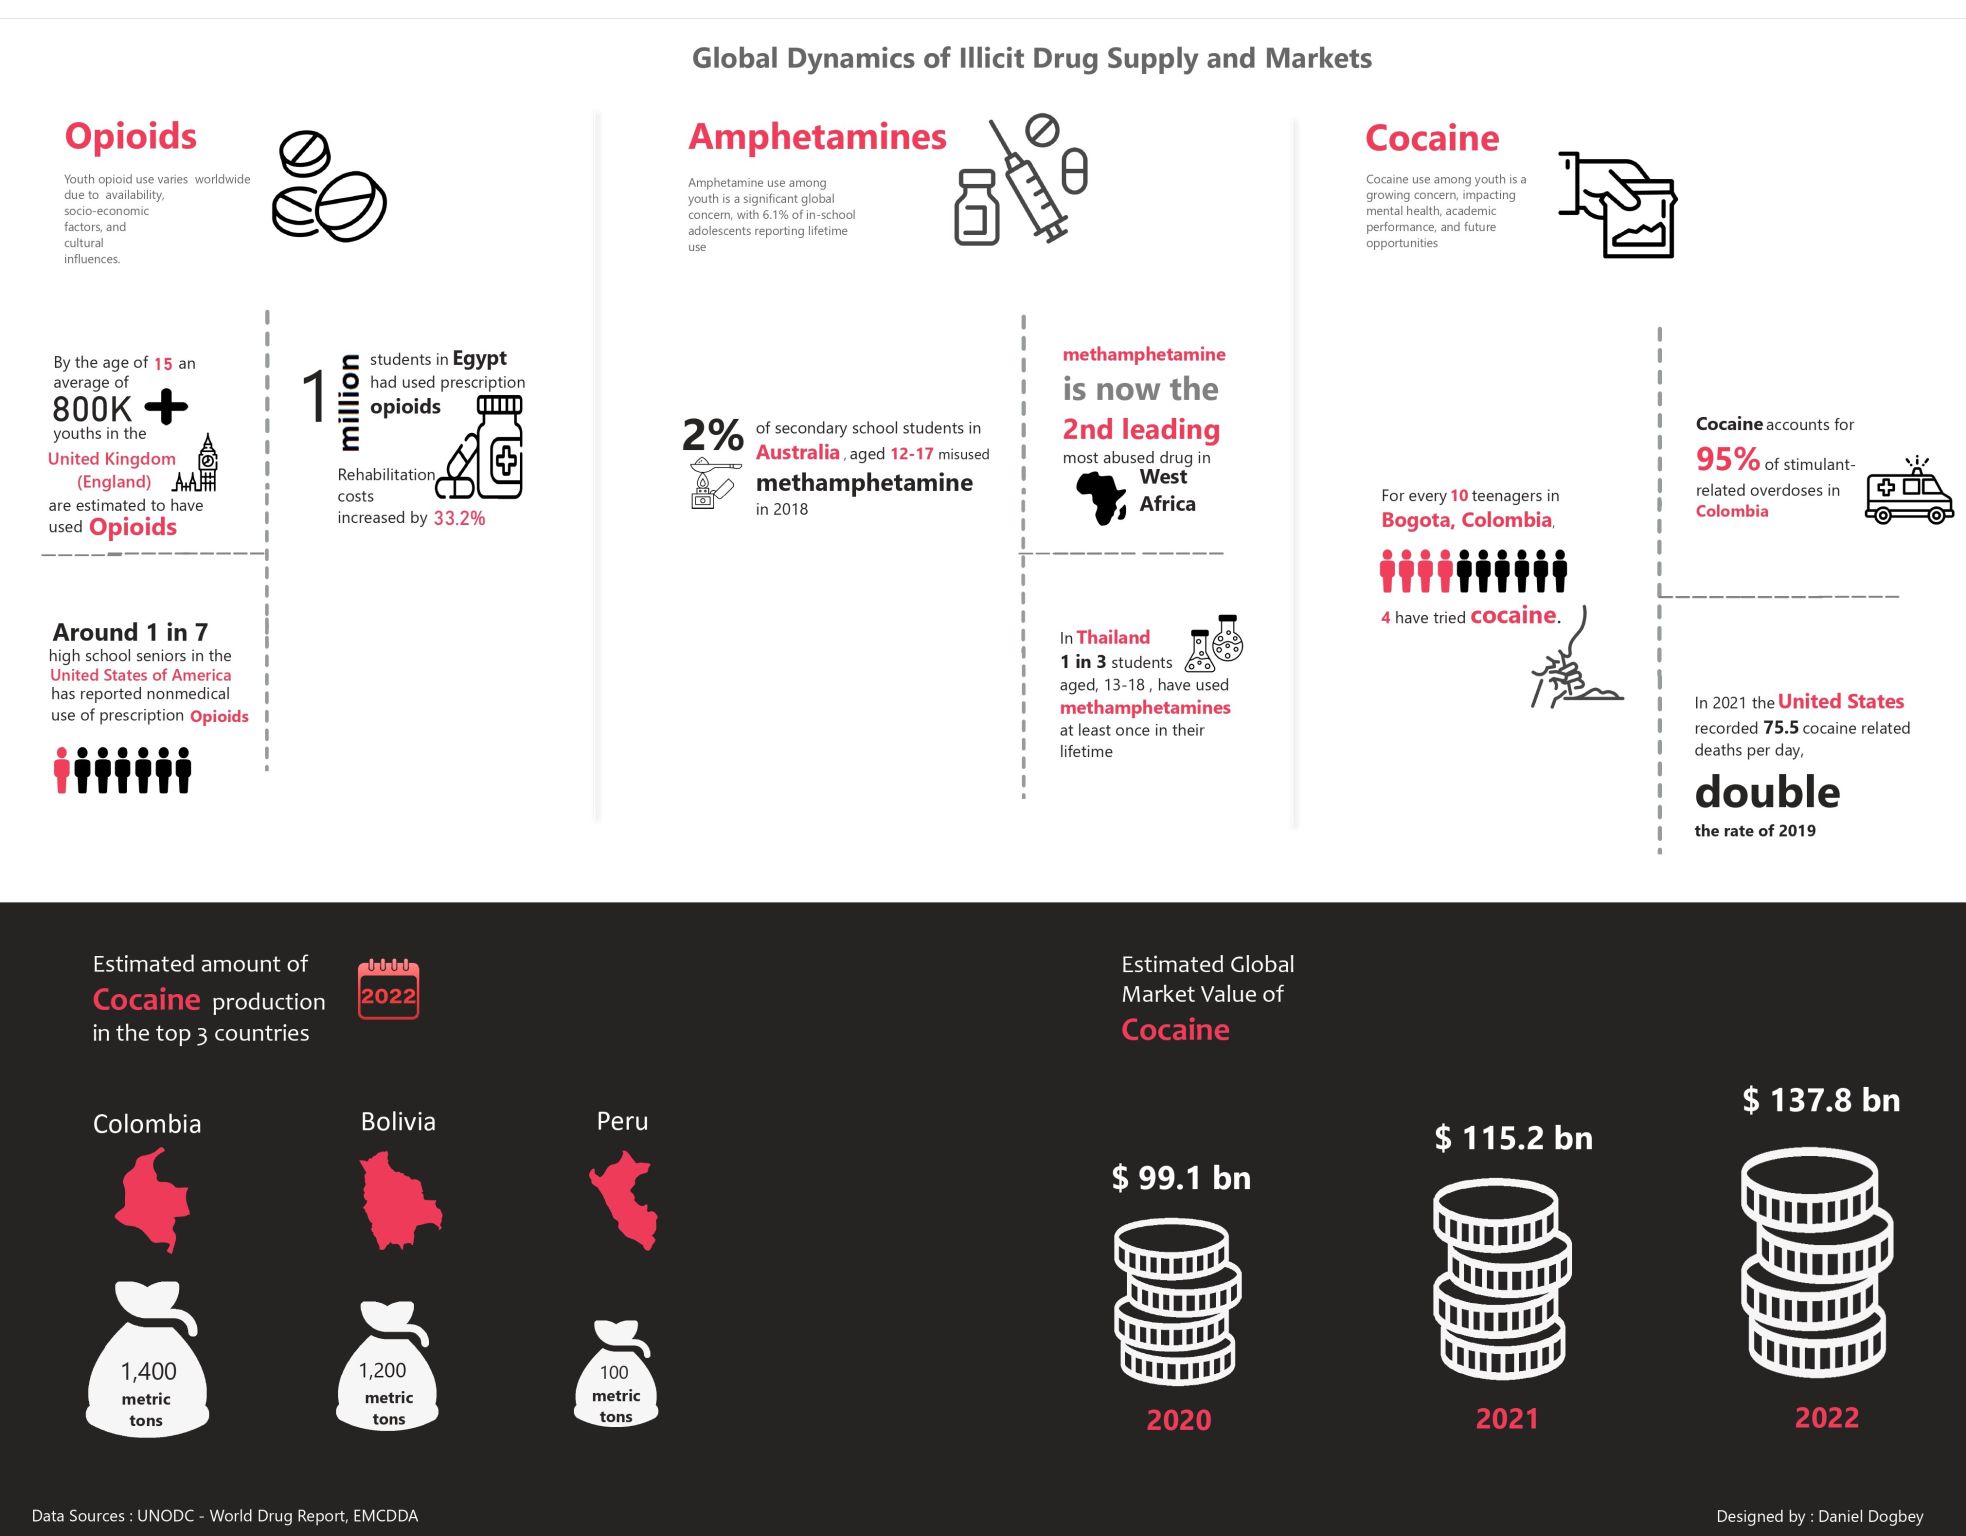
Global Dynamics of Illicit Drug Supply and Markets
AWS Cloud Pipeline for Semiconductor Market Analysis
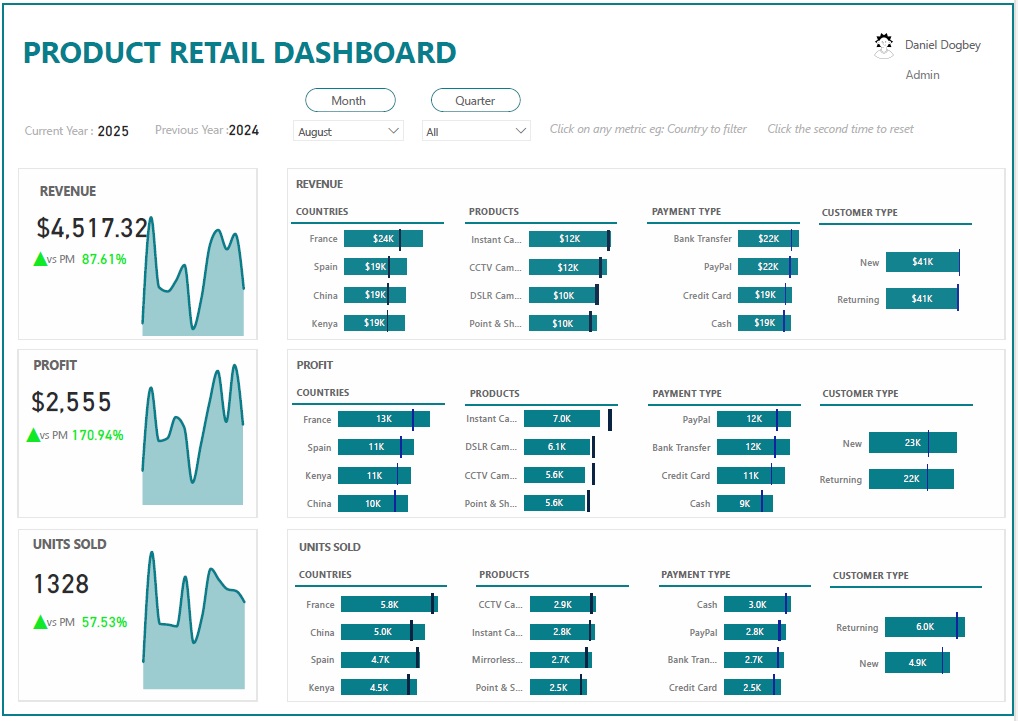
Power BI dashboard: Analyzing Retail Camera Sales / Revenue / Profit
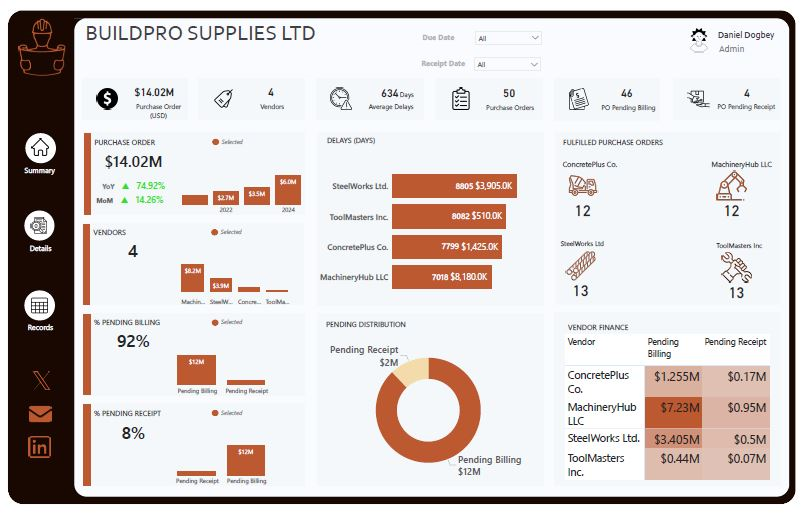
Power BI dashboard: Purchase Orders Analysis
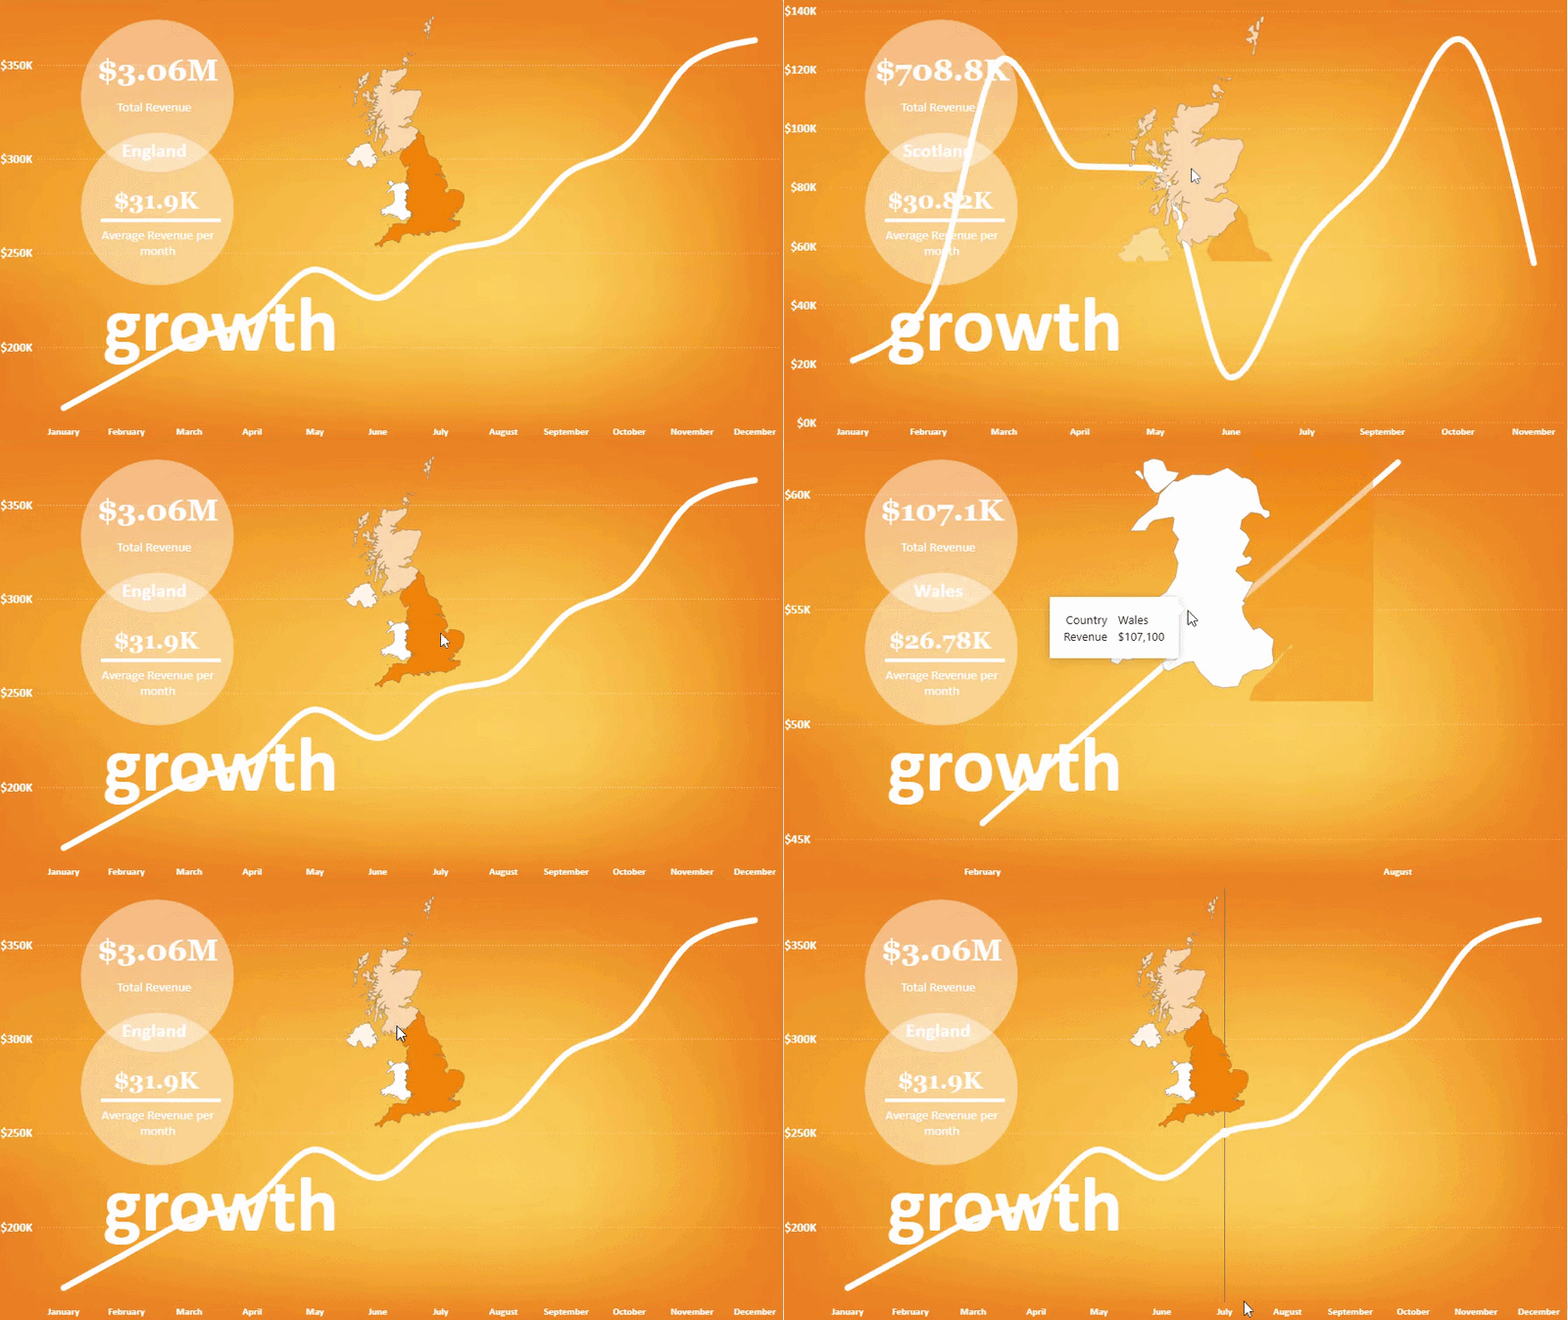
The Growth Story: Revenue Across Months & Markets
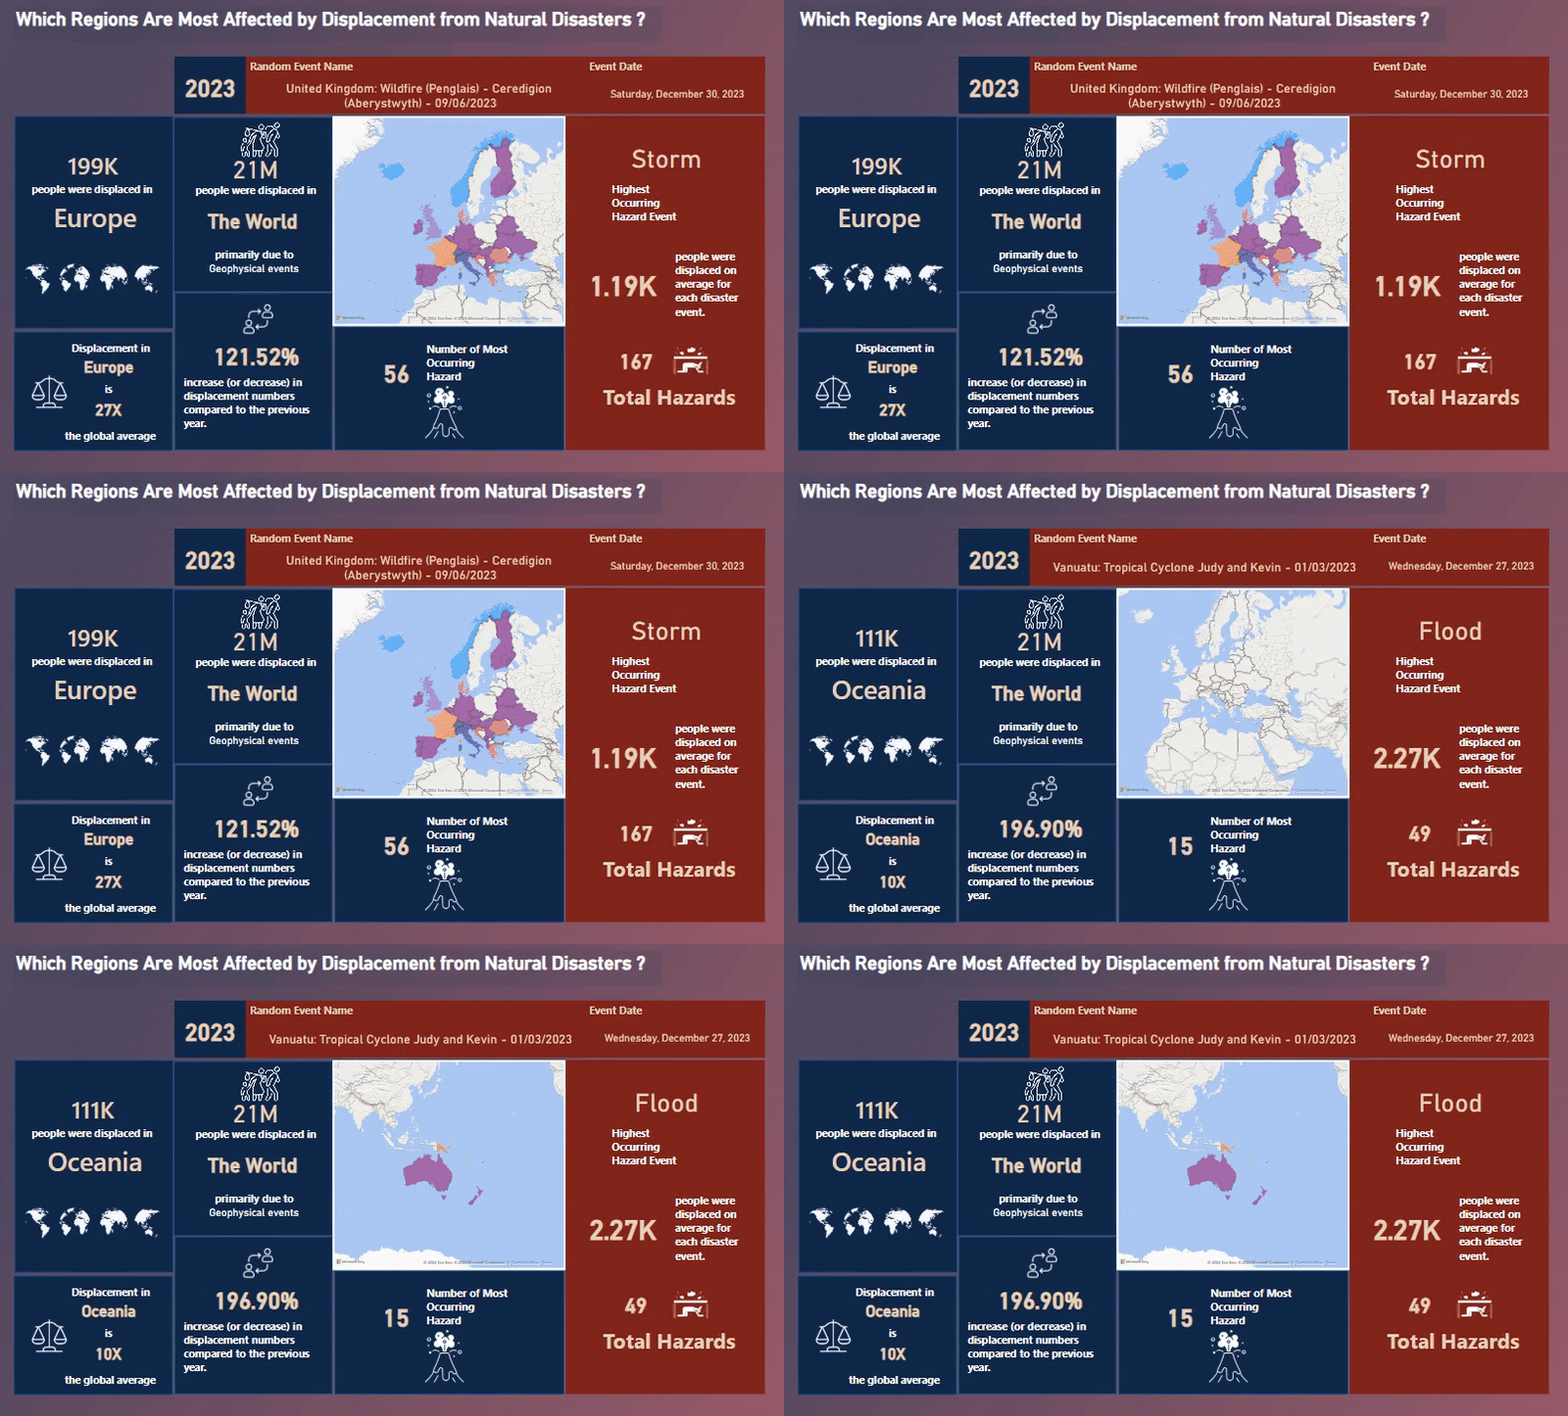
Power BI Infographic Report: Global Displacement and Climate Impact 2023
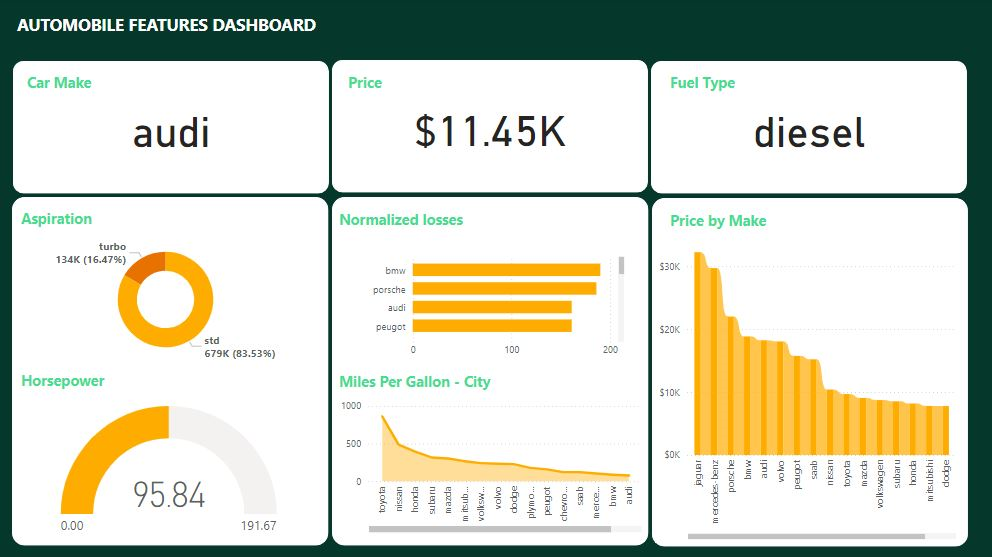
Power BI Automobile Fuel Consumption Analysis & Visualization
Data Science Jobs Trend Analysis & Prediction with Decision Trees & KNN Clustering
Fuel Consumption & C02 Emissions Analysis & Prediction + Multiple Linear Regression
Semi-Arid Farming Analysis: Rainwater Harvesting Impact
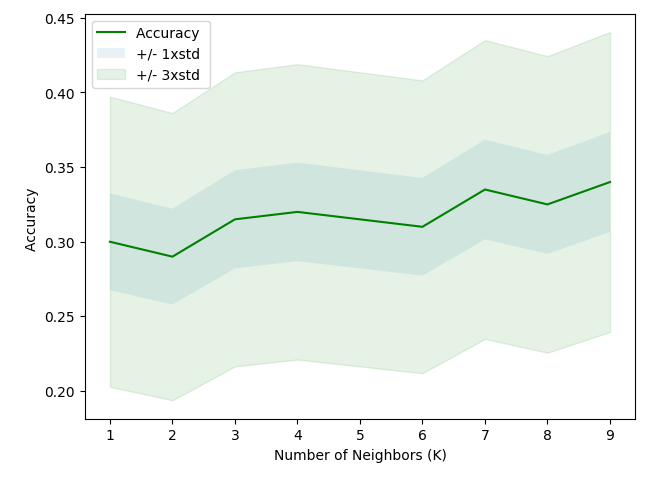
Telecommunications Customer Segmentation + KNN Clustering
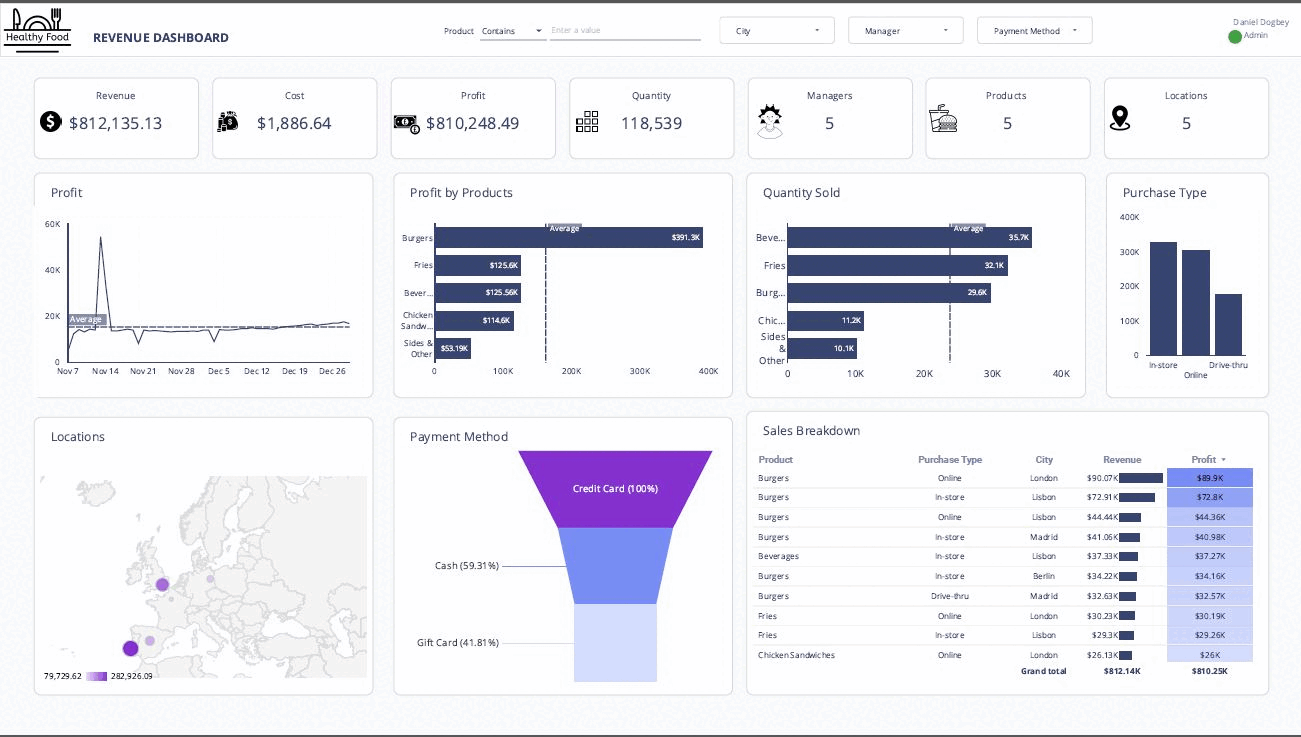
Looker Studio dashboard: Visualizing revenue, sales , profit etc for Fast food items sold
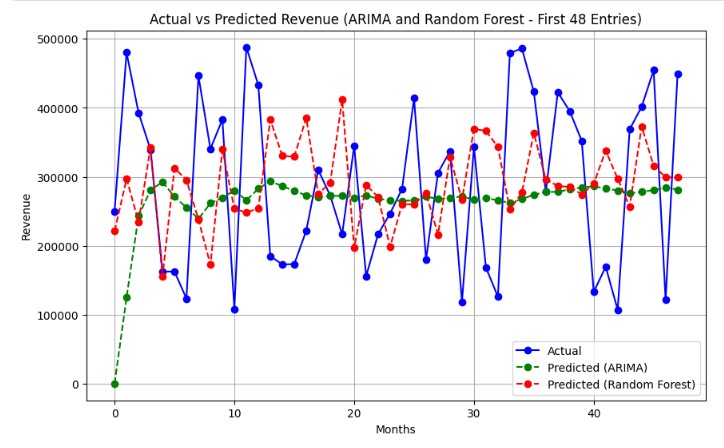
PharmaCrest Financial Analysis & Revenue Forecasting
Data model
A look beneath the dashboard.
Before a dashboard can answer the right questions, the data behind it needs to be structured correctly. A well-designed data model connects business processes, keeps metrics consistent, and makes reporting easier to scale.
Reliable metrics
A consistent structure reduces conflicting numbers across reports and gives teams a dependable foundation for analysis.
Connected information
Sales, products, locations, supervisors, and dates can be analyzed together instead of living in disconnected reports.
Scalable reporting
A well-structured model makes it easier to add data and build new dashboards without rebuilding the reporting foundation.
Explore the model: click a table or field to see its relationships.
dim_dateDimension
dim_productDimension
fact_salesFact table
dim_locationDimension
dim_supervisorDimension
Why this matters: the model sits between the business question and the dashboard. It is the foundation that makes analysis consistent, explainable, and easier to extend.