Dashboards & reporting
Bring the metrics that matter into a clear view for the people making decisions.
Power BI or Looker Studio dashboards · Metric definitions · Handover documentationDATA ENGINES / SERVICES
For businesses and programmes with scattered records, time-consuming reporting, or questions their current dashboards don’t answer.
Discuss your projectBring the metrics that matter into a clear view for the people making decisions.
Power BI or Looker Studio dashboards · Metric definitions · Handover documentationFind inconsistencies, improve structure, and establish checks before issues reach your reports.
Data-quality assessment · Cleaned datasets · Validation rulesConnect sources, transform records, and prepare dependable datasets for reporting on AWS or GCP (BigQuery).
Cloud pipelines · Python & SQL ETL · Scheduling & handover documentationReduce repetitive preparation and delivery work with a reporting workflow built around your needs.
Python & SQL workflows · Scheduled reporting · DocumentationTurn structured performance data into readable summaries with appropriate review and validation.
Narrative summaries · API workflows · Review checkpointsPresent programme results or business performance in a readable, shareable web report.
Visual narrative · Charts & annotations · Responsive report pageRELEVANT PROJECT WORK
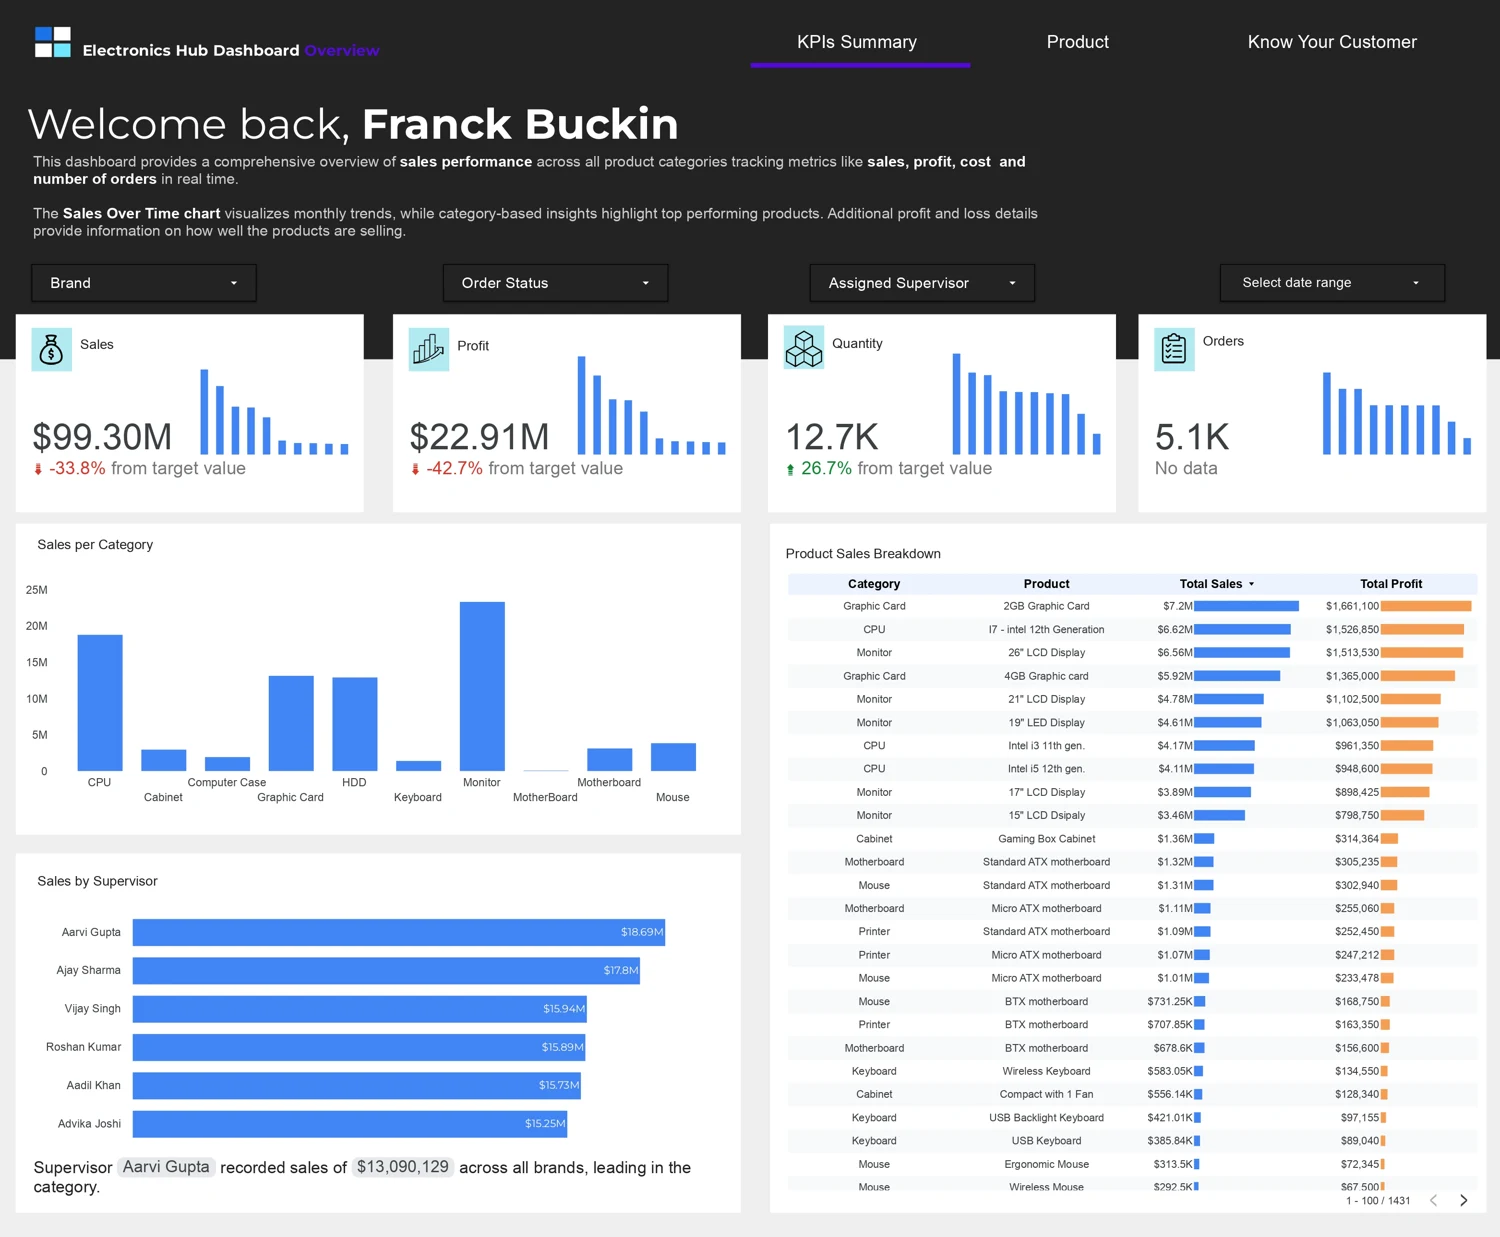
A selection of dashboard, automation, and pipeline projects showing how the work comes together.
FEATURED SERVICE / REPORT WEBSITES
An annual report, programme evaluation, or impact update, built as a report website you can add to your own site.
A board update, an annual review, or a programme evaluation deserves more than a dense attachment. I bring the findings together in a web report that leads the reader through the story.
Two illustrative portfolio reports. Sample figures are explained within each report.
Click the preview or button to explore the complete report website.
HOW WE WORK TOGETHER
A discovery conversation about your data, audience, and goals.
Align on deliverables, access, timeline, and pricing before work starts.
Share progress and check the work against your actual needs.
Deliver the files, documentation, and guidance your team needs.